A proper analysis of pharmacokinetic (PK) data can have incredible implications. Something to think about is how the data should be prepared prior to any statistical analysis. This brings me to the goal of this post – to log or not to log, that is thy question. The short answer is yes, PK parameters should be log-transformed but I’ll walk through some examples and provide some rationale to this short answer.
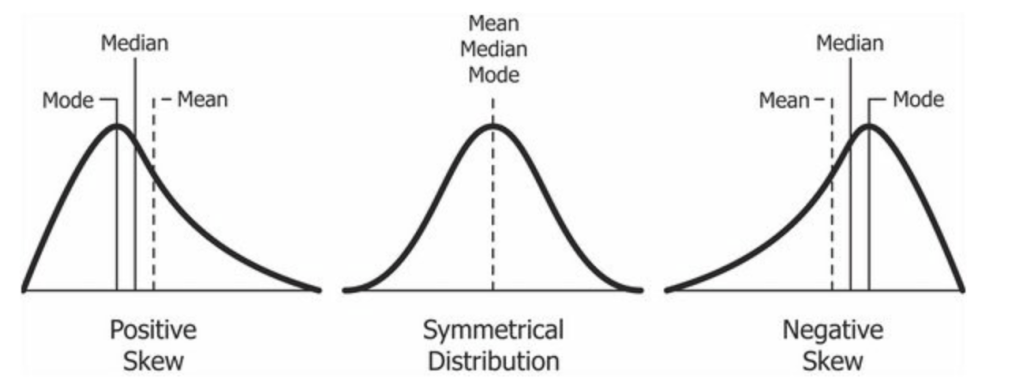
We can start with a very simple question: Can any physiological parameter be less than zero (i.e., weight, age, muscle mass, blood volume, etc)? Of course not! Therefore these values will always be positively skewed where the types of data distributions can be seen below in Figure 1.
This is also true for the physiological PK parameters for half-life, clearance, the volume of distribution. Let’s look at simulations that are plotted below (Figure 2).
You can see that there are several values that are much further to the right than the majority of the data indicating a positive skew. I would instantly say that these are not normally distributed but your biostatistician might not agree. How can you convince them that your PK parameters and metrics should be log-normal before any statistical analysis? You can eye-ball the plot to show them, however, that might not be very convincing or you can simply conduct a Shapiro-Wilks test of normality. A Shapiro-Wilks test (conducted on the above dataset) tests whether the distribution follows a normal distribution where a p-value less than 0.05 ( p < 2.2 e-16) indicates that the distribution is not normal. What happens when we take this same data and log-transform the individual values and re-run the Shaprio test? We now have a normal distribution, where the p-value is greater than 0.05 (p = 0.3237)
As I mentioned above, there might be implications when the data is not log-transformed. Let’s take a look at a bioequivalence (BE) assessment. In the FDA guidance for BE (2014), it is recommended for “log-transformation of exposure [AUC] measures before statistical analysis.” You might say okay let’s log transform the AUC and keep moving along, but what if someone asks you why this mathematical manipulation of the data is required? You might point them to the discussion above but what if you analyze the data on the raw data (non-transformed data)? Well, you might get some inconclusive results in which your confidence interval is outside the 80-125% limits for BE.
Further confusing this issue is the relationships between dose, clearance, exposure, and bioavailability. If we consider an IV dose then bioavailability is no longer in the equation so we have:
Clearance = Dose/ AUC
Comparison of Dose vs. AUC should yield a linear relationship if the system is under linear pharmacokinetics, which the majority are. As we have mentioned above, PK parameters are often log-normally distributed, and thus if you would like to compare clearance as a function of dose, you may plot on a log-log plot.
While this concept of log transformation might be slightly confusing, I hope that this post helps to clarify situations when you would use the log-transformed values due to their inherent non-normal distribution.
